Population waves
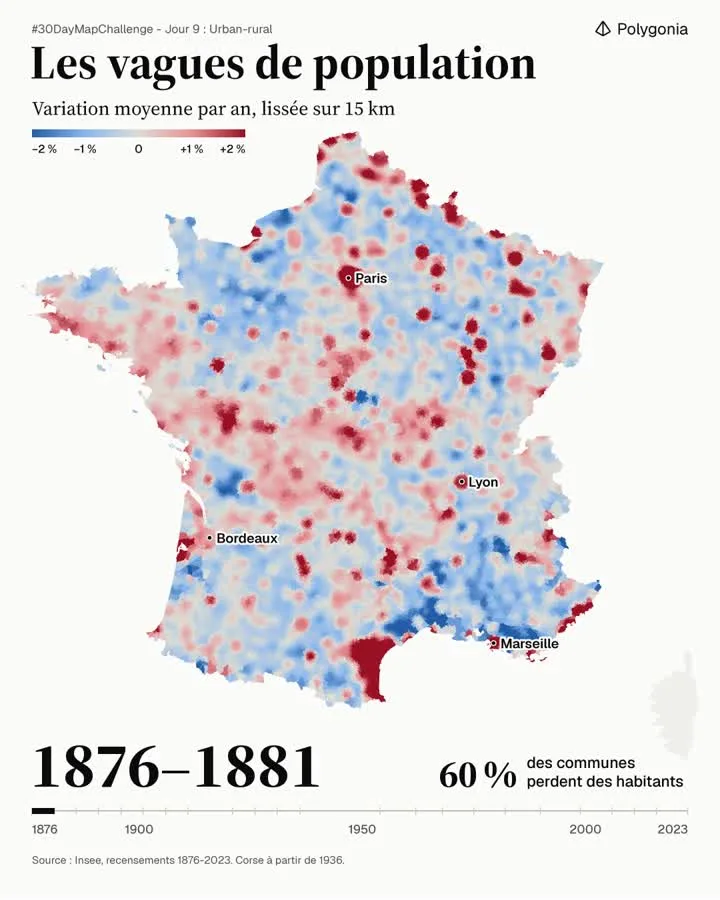
Animated map of the average yearly population change in France, smoothed over 15 km, from 1876 to 2023. It shows rural depopulation and the growth of large cities.
- Author
 Bastien MARSAUDPolygonia
- Themes
- Places
- Collection
What the map shows
The map shows the average yearly population change of French municipalities, smoothed over 15 km. Blue shades indicate decline (down to -2%) and red shades indicate growth (up to +2%). The image shown corresponds to the 1876-1881 period, when 60% of municipalities lose inhabitants. A timeline from 1876 to 2023 shows that the map is animated by census period. According to the author, between 25% and 67% of municipalities lose inhabitants depending on the period, and more than 10,000 municipalities lost over half of their inhabitants between 1876 and 2023. Smoothing softens local contrasts; Corsica is only included from 1936.
Sources
- Insee, recensements 1876-2023