2026 municipal elections: winning political affiliations in a Dorling cartogram
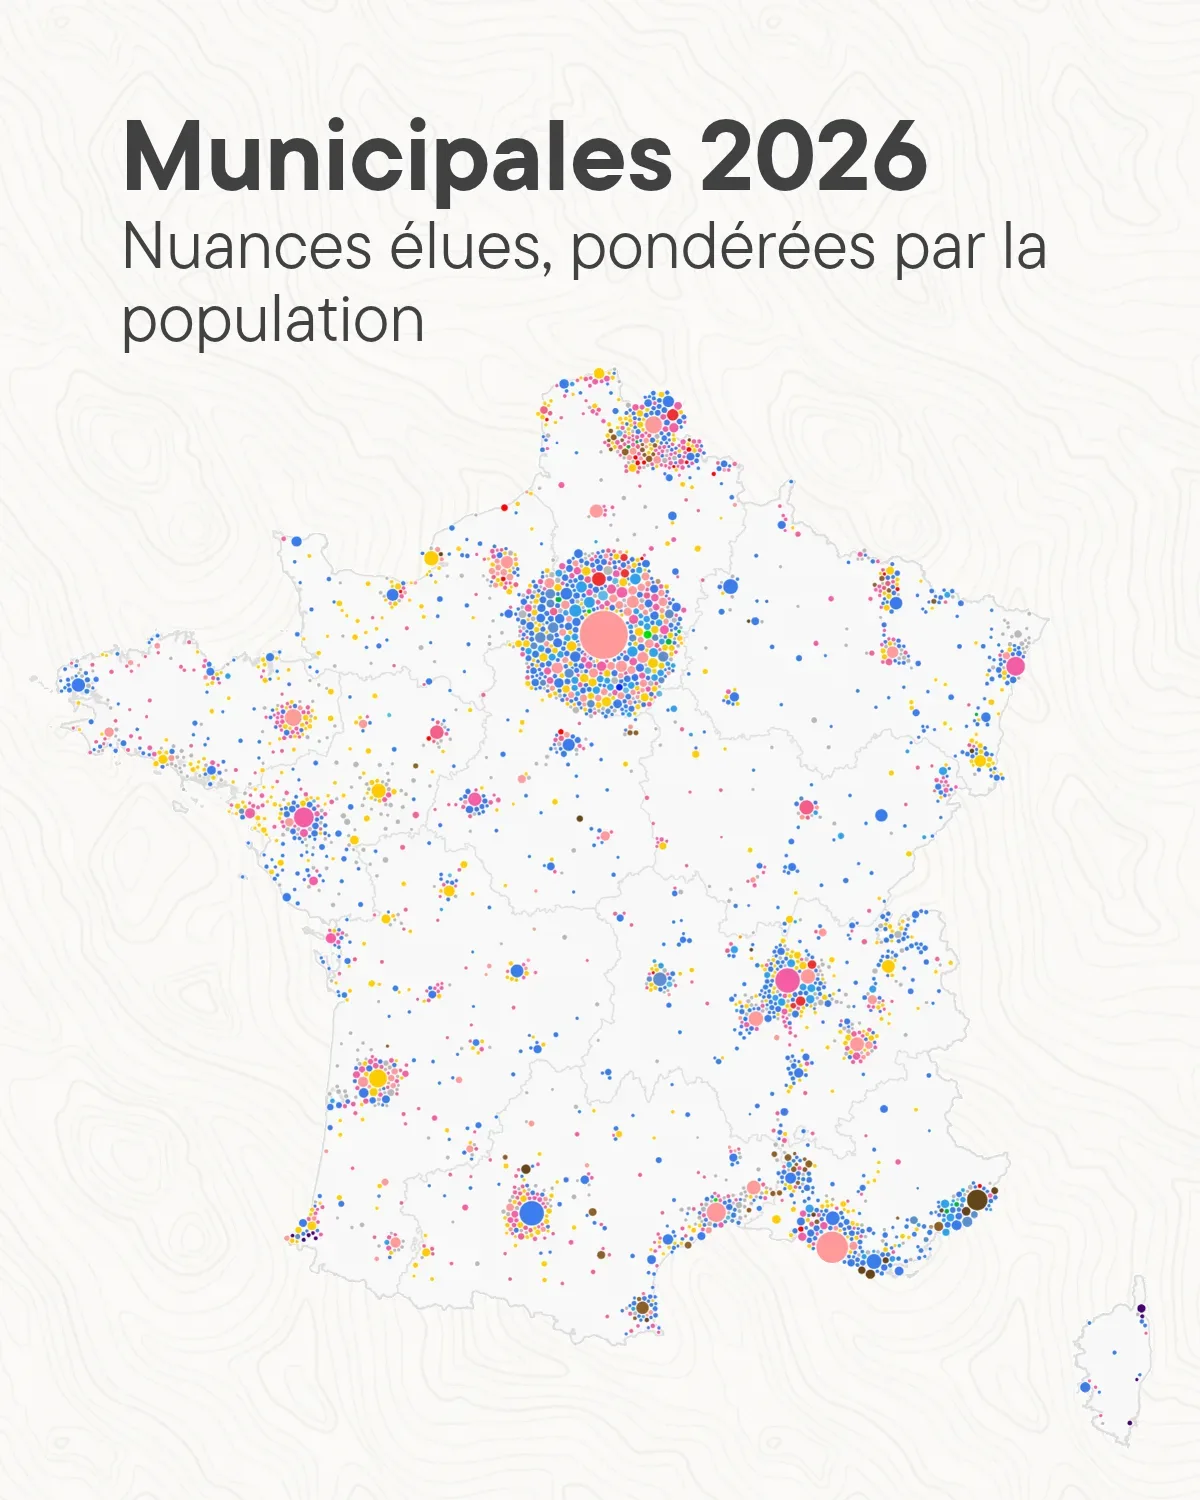
Dorling cartogram of mainland French municipalities, where each circle is sized by population and coloured by the political label elected in the 2026 municipal elections. Large cities keep their position and smaller communes are arranged around them.
- Author
 Bastien MARSAUDPolygonia
What the map shows
Each municipality is replaced by a circle proportional to its population, and the color indicates the political affiliation of the winning list. The largest circles, such as Paris, Marseille, Lyon or Toulouse, stay close to their original location, while the smaller circles are distributed around them. This representation adds demographic weight, which is absent from conventional category maps. The legend for the affiliations is not visible in the image, which limits how the colors can be read. The page states that the second-round results were not yet available as open data and were collected by hand, and a comment points out errors on another map in the series.