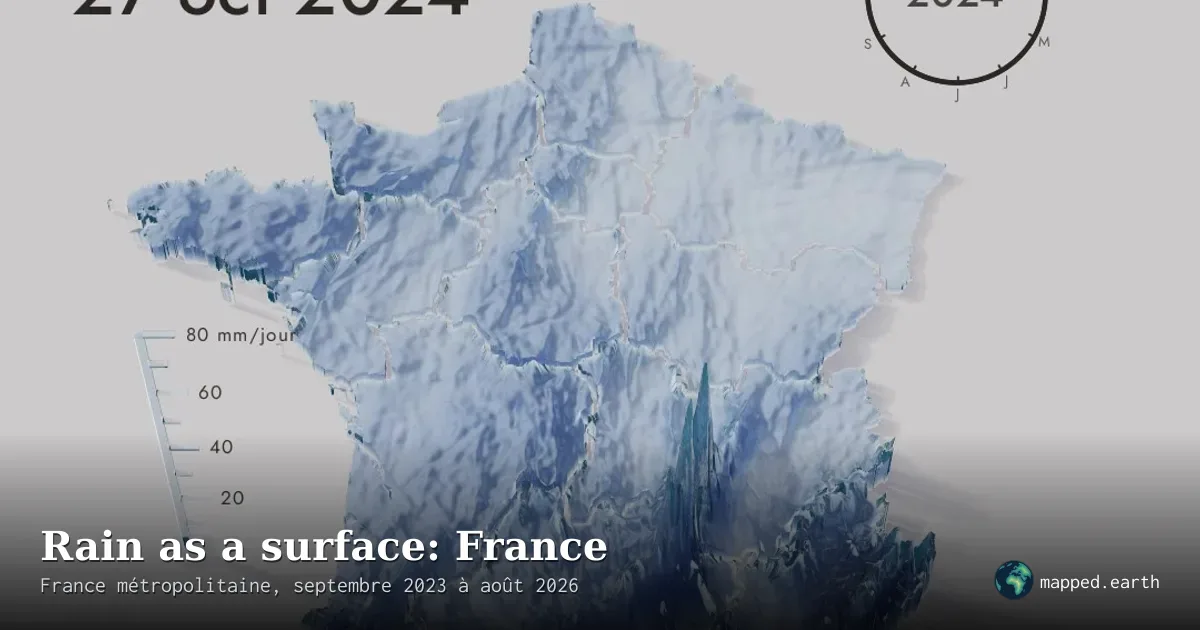
Daily rainfall in France as a 3D relief, over 36 months
This 3D relief map shows daily rainfall across mainland France: each square kilometre rises according to the rain it receives, animated from September 2023 to August 2026. A mm/day scale and a yearly clock help read the displayed date.
- Author
Shared by Loïc PICAVET
- Places
What the map shows
The map shows rainfall as a three-dimensional surface over metropolitan France, with regional boundaries drawn as an overlay. The height and color of each point reflect precipitation intensity, on a scale reaching up to 80 mm/day. A date (here, 27 October 2024) and a circular clock indicate the current moment of the animation, which can be played, browsed and rotated. The very pronounced peaks in the southeast, near the Cévennes and the Massif Central, correspond to a heavy rainfall episode. The page does not cite the source of the precipitation data, which limits verification. The exaggerated relief makes it difficult to read precise values without interacting with the map.