French power plant observatory
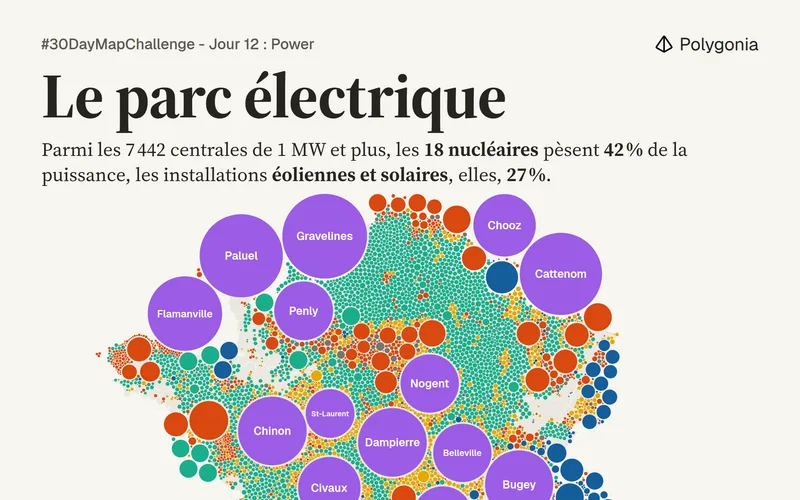
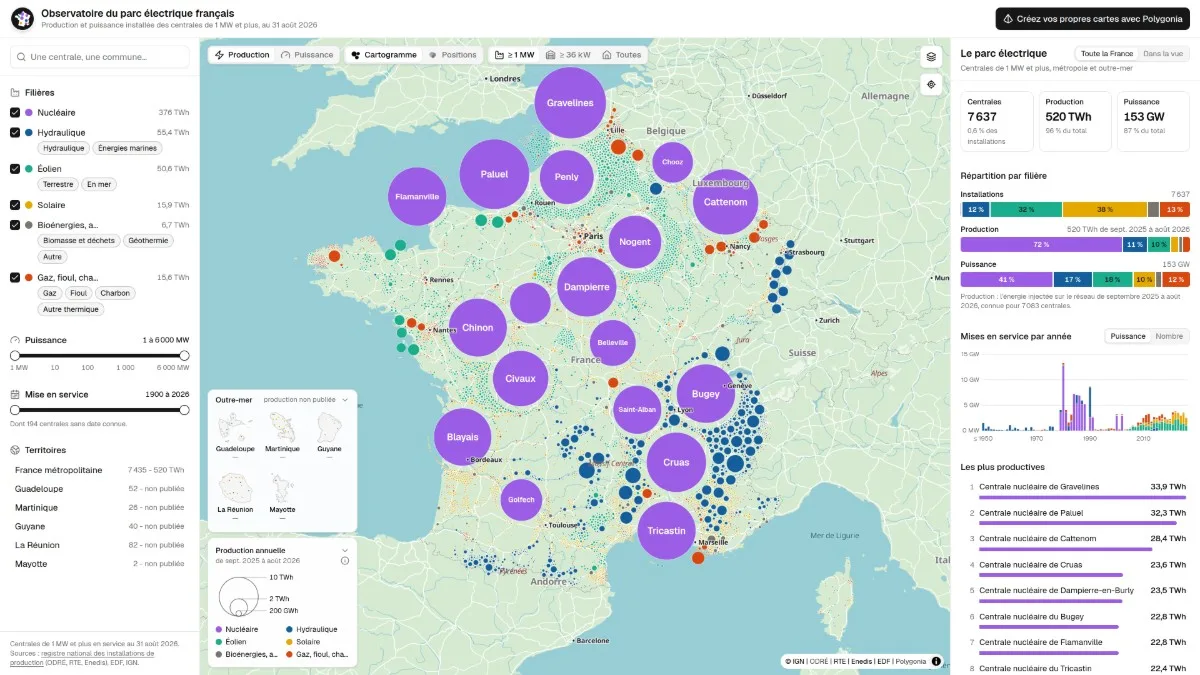
Interactive map of the 7,637 power plants of 1 MW and above in France, mainland and overseas, shown as a Dorling cartogram by annual output. It lets users explore the fleet by energy source, capacity and commissioning year.
- Author
 Bastien MARSAUDPolygonia
- Themes
- Collection
What the map shows
Each circle is a power plant, sized by annual output (September 2025 to August 2026) or by capacity, and colored by source: nuclear, hydro, wind, solar, bioenergy, gas, oil and coal. The right-hand panel shows 7,637 plants, 520 TWh produced and 153 GW installed. Nuclear supplies 72% of output with 41% of capacity. Filters let users select sources, capacity and commissioning year. The panel also ranks the most productive plants, with Gravelines first. Output for overseas territories is not published, and 194 plants have no known commissioning date.
Sources
- Registre national des installations de production (ODRÉ, RTE, Enedis, EDF)
- IGN