The French power plant fleet in 2026
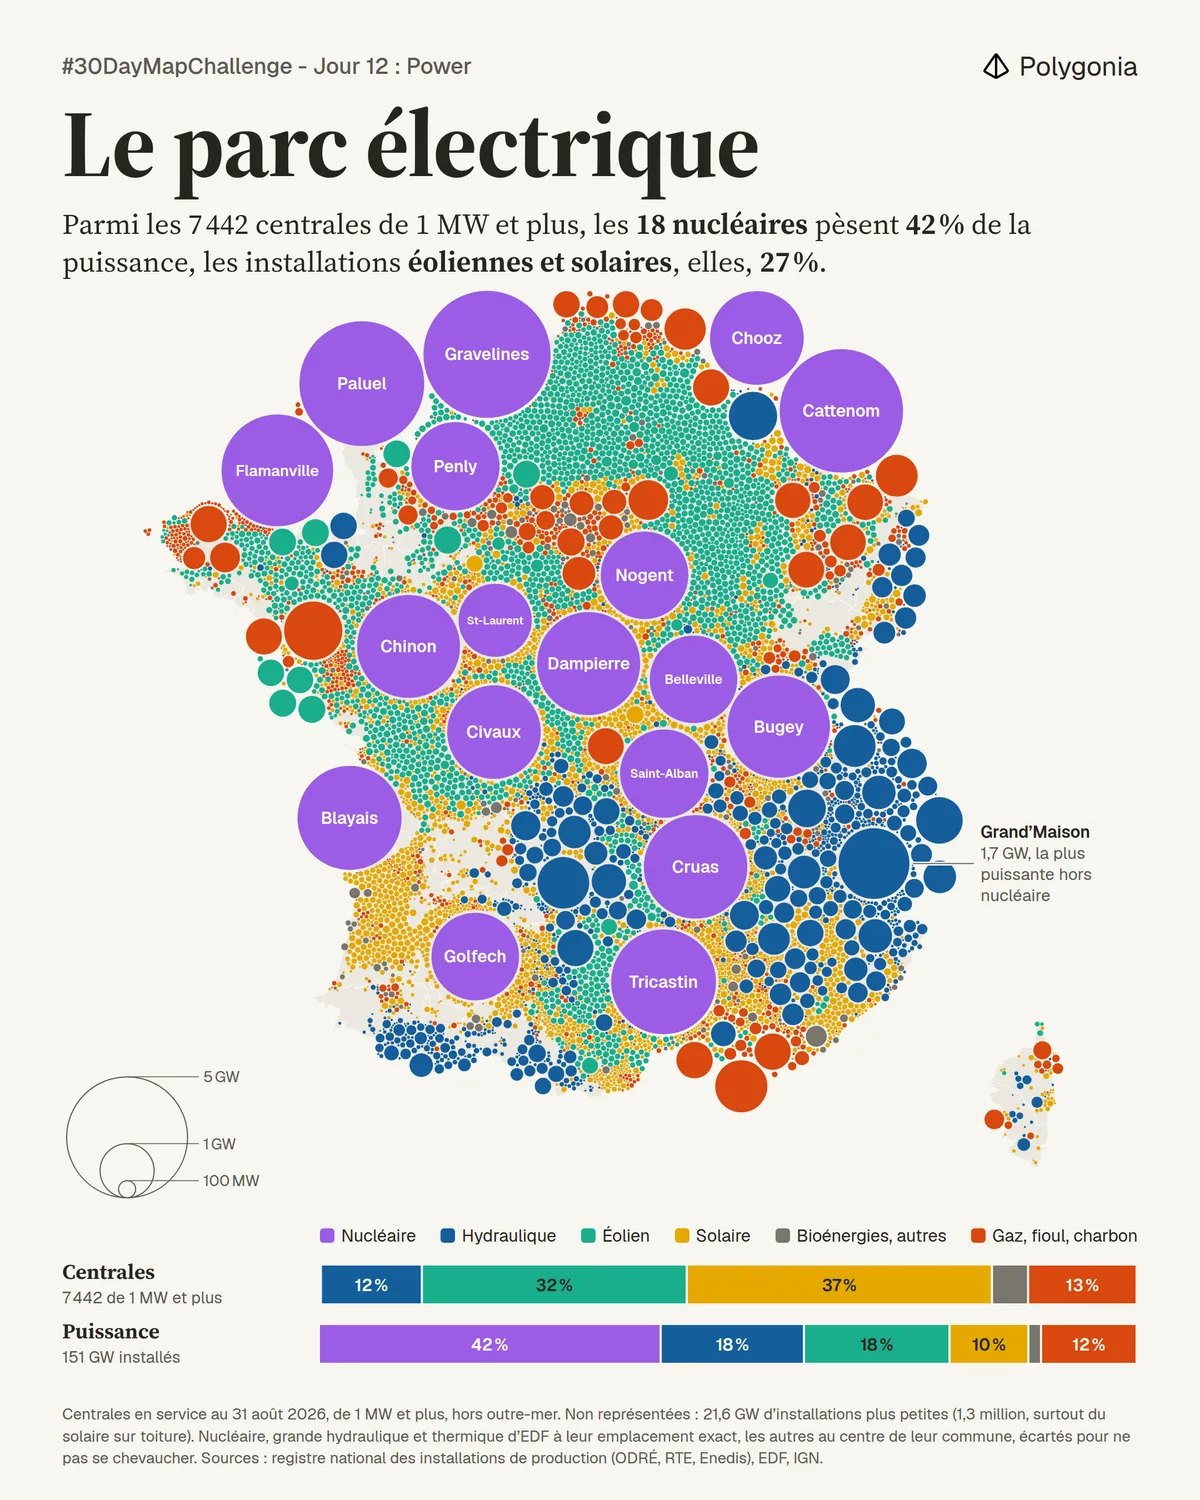
Dorling cartogram of the 7,442 power plants of 1 MW and above in mainland France, by capacity and energy type. The 18 nuclear plants account for 42% of installed capacity.
- Author
 Bastien MARSAUDPolygonia
- Themes
- Places
- Collection
What the map shows
Each circle represents a power plant or farm, sized by installed capacity and colored by energy type: nuclear, hydro, wind, solar, bioenergy and others, gas, oil and coal. Circles are placed at the center of their municipality and spread apart to avoid overlap, except nuclear and large EDF hydro plants, which sit at their exact location. Two stacked bars compare each source's share by number of plants and by capacity out of 151 GW installed: wind and solar make up about 70% of sites but 27% of capacity. The map excludes overseas territories and installations under 1 MW (21.6 GW, mostly rooftop solar), whose position is only known at département level, so it does not show the full electricity mix. Plants are those in service on 31 August 2026.
Sources
- Registre national des installations de production (ODRÉ, RTE, Enedis)
- EDF
- IGN