Map artWorld · LinkedIn9views
Tuesday 10 November · previous maps
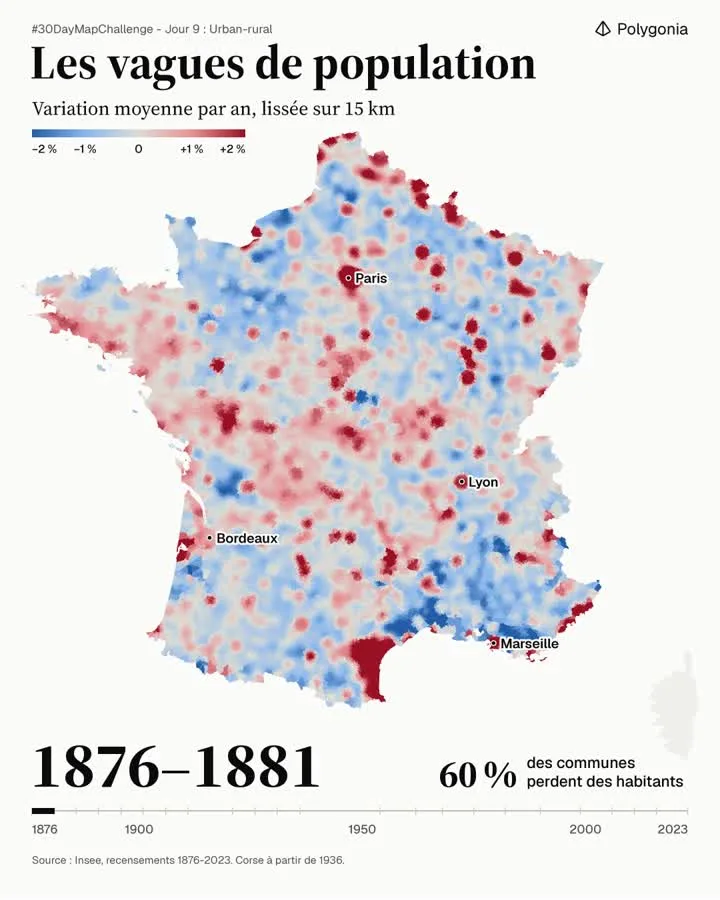
Animated map of the average yearly population change in France, smoothed over 15 km, from 1876 to 2023. It shows rural depopulation and the growth of large cities.

Join the community: submit a link to your map, or an image of it. It gets described, filed and made easy to find, and you can follow its views. No sign-up, no password.